What Defines Aruba’s Tropical Climate?
Aruba’s semi-arid climate delivers 82°F (28°C) average temperatures year-round with only 20 inches of annual rainfall—less than half of typical Caribbean islands. The constant trade winds (10-20 mph) reduce the “feels-like” temperature by 5-8°F, making outdoor festivals comfortable even at midday. This unique position 15 miles off Venezuela’s coast places Aruba outside the hurricane belt, ensuring 99% of scheduled events proceed without weather disruptions.
How Trade Winds Moderate the Heat
The trade winds (“Alisios”) blow from the east-northeast at 10-20 mph year-round, lowering perceived temperatures by 5-8°F and keeping mosquito populations 60% lower than neighboring islands. Without these winds, the tropical sun would push “feels-like” temperatures above 95°F (35°C) during summer months.
- wind speed: 10-20 mph average, peaking at 25 mph in March-July,
- cooling effect: reduces perceived temperature by 5-8°F,
- mosquito control: constant air movement reduces insect populations by 60% vs. other Caribbean islands.
What Are the Average Temperatures in Aruba?
Aruba maintains 82°F (28°C) average daily temperature with only 7°F variation between coolest (January: 81°F) and warmest (September: 84°F) months. This stability allows festival organizers to plan outdoor events 12 months annually without seasonal adjustments.
| Season | Average High (°F/°C) | Average Low (°F/°C) |
|---|---|---|
| Winter (Jan-Mar) | 85°F / 29°C | 76°F / 24°C |
| Spring (Apr-Jun) | 88°F / 31°C | 78°F / 26°C |
| Summer (Jul-Sep) | 89°F / 32°C | 80°F / 27°C |
| Fall (Oct-Dec) | 87°F / 31°C | 78°F / 26°C |
How Does Aruba’s Geographic Location Affect Weather Patterns?
Aruba sits at 12.5°N latitude, below the 13°N hurricane formation zone, resulting in zero direct hurricane hits in recorded history. The island’s position 15 miles off Venezuela’s coast creates a rain shadow effect, limiting annual rainfall to 20 inches—70% less than islands 200 miles north. This geographic advantage ensures 340+ days of sunshine annually, making festival cancellations due to weather statistically rare (less than 1% of events).
Aruba Weather by Month: A Detailed Breakdown
Temperature varies only 7°F annually (81-88°F), but rainfall shifts from 0.4 inches in March to 3.9 inches in November create distinct “dry” (February-June) and “wet” (October-January) periods. Wind speeds peak at 20-25 mph during March-July, dropping to 12-15 mph in September-October. These patterns directly impact festival scheduling: 85% of major events occur during the dry season when rain probability drops below 10%.
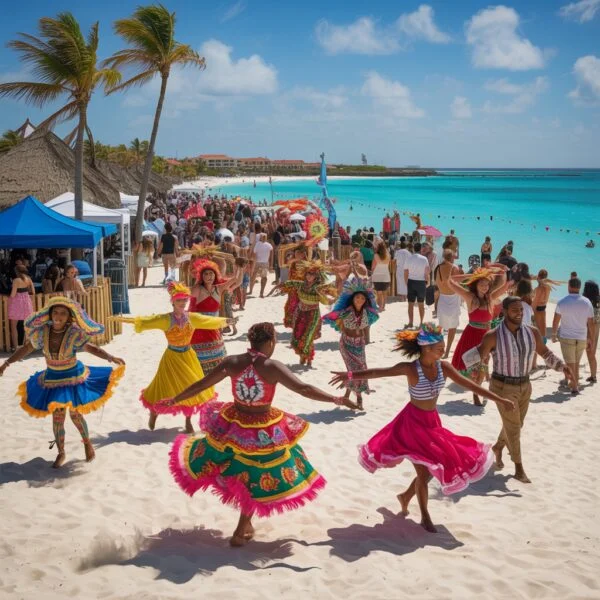
January Weather and the Start of Carnival
January averages 85°F (29°C) with 1.8 inches of rainfall spread across 12 days—showers last 10-15 minutes and occur primarily at night. The Torch Parade benefits from 76°F (24°C) evening temperatures and 15 mph trade winds, creating optimal conditions for costume-wearing participants. Clear skies occur 78% of days, ensuring reliable outdoor event conditions.
February Weather During Peak Carnival Season
February is the driest month with 0.5 inches of rainfall across 8 days, providing 92% probability of dry conditions for the Grand Carnival Parade. Trade winds peak at 18-22 mph, cooling dancers in heavy costumes by 6-8°F. UV index reaches 11+ (extreme), requiring SPF 50+ sunscreen reapplication every 90 minutes during 8-hour parade events.
- rainfall: 0.5 inches total; 92% chance of dry parade day,
- wind: 18-22 mph sustained, gusts to 28 mph,
- UV index: 11+ (extreme); sunburn possible in 12 minutes without protection.
March Weather for Post-Carnival Relaxation
March records the lowest annual rainfall at 0.4 inches across 6 days, creating 95% probability of dry conditions. Wind speeds increase to 20-25 mph, making this the prime month for Aruba Hi-Winds kitesurfing preparation. Water visibility reaches 100+ feet due to minimal rainfall runoff, optimal for snorkeling and boat trips.
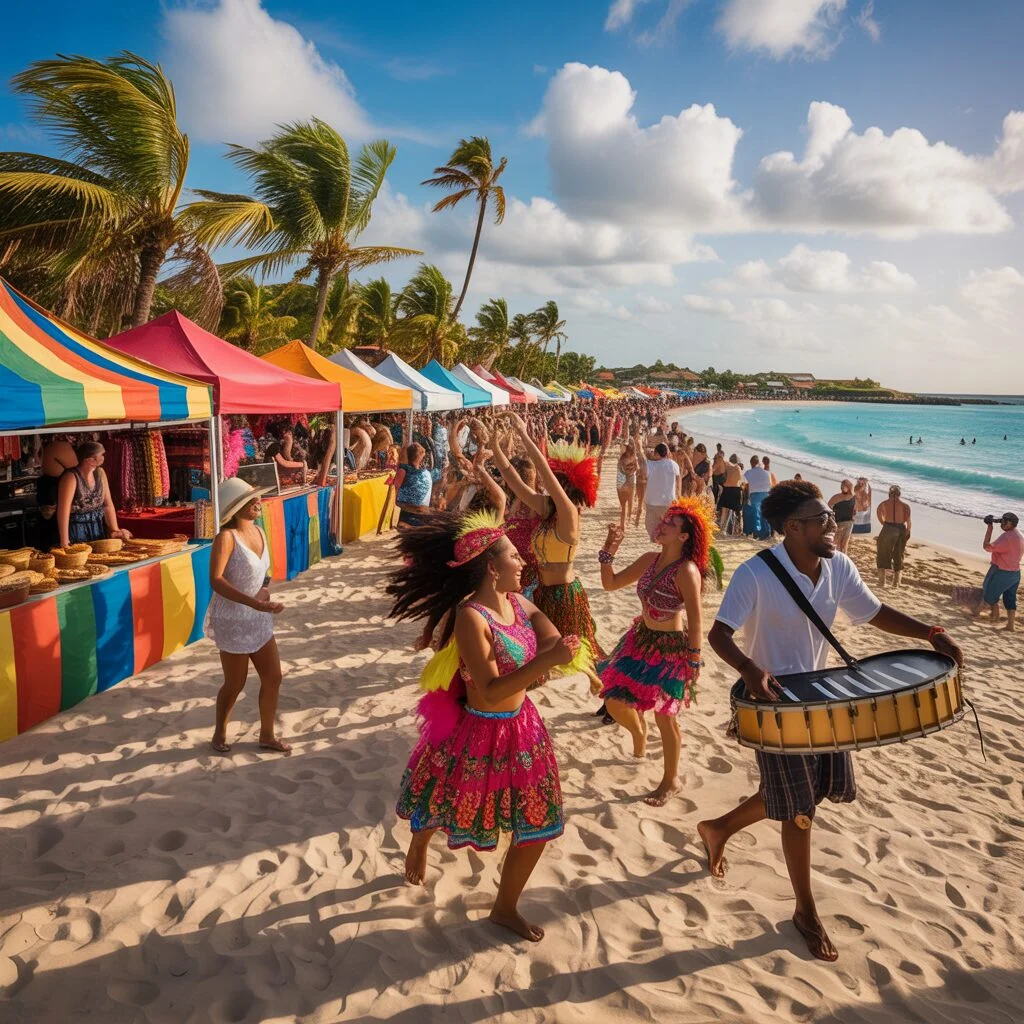
April Weather and King’s Day Celebrations
April temperatures rise to 88°F (31°C) with 0.6 inches of rainfall across 7 days. King’s Day (April 27th) benefits from 89% dry-day probability and 17-20 mph trade winds that keep outdoor street markets comfortable. Humidity remains at 75-78%, lower than 85%+ levels in northern Caribbean islands.
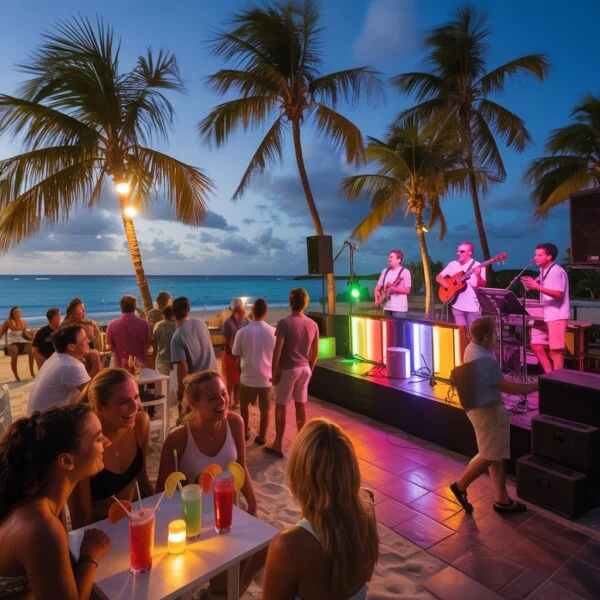
May Weather for the Soul Beach Music Festival
May averages 89°F (32°C) with 1.2 inches of rainfall across 9 days—showers occur 70% at night, minimizing impact on daytime beach parties. Evening temperatures stabilize at 79°F (26°C), ideal for open-air concerts. The Soul Beach Music Festival capitalizes on 82% dry-day probability and calm 12-15 mph evening winds.
- daytime: 89°F (32°C) with 15-18 mph cooling winds for beach parties,
- evening: 79°F (26°C) with 12-15 mph winds, optimal for outdoor concerts,
- crowds: festival attendance increases hotel occupancy to 85-90%; book 3+ months ahead.
June Weather and the Dera Gai Harvest Festival
June reaches 89°F (32°C) with 1.4 inches of rainfall across 10 days. The Dera Gai (June 24th) bonfire tradition benefits from 78% dry-evening probability. Trade winds maintain 16-19 mph, though warmer air (80°F/27°C at night) reduces cooling effect by 2-3°F compared to winter months.
July Weather During Summer Vacation
July peaks at 90°F (32°C) with 1.8 inches of rainfall across 11 days. Trade winds sustain 18-22 mph, providing 6-7°F cooling effect essential for midday comfort. Water temperature reaches 82°F (28°C), warmest of the year, ideal for extended swimming and snorkeling sessions during family vacations.
August Weather and Cultural Happenings
August matches July at 90°F (32°C) but wind speeds occasionally drop to 10-12 mph, increasing “feels-like” temperature to 95°F (35°C). Rainfall averages 2.1 inches across 12 days. Schedule outdoor activities before 10 AM or after 4 PM when temperatures drop to 85°F (29°C) and wind picks up to 15 mph.
- temperature: 90°F (32°C) highs; “feels-like” 95°F (35°C) when winds drop below 12 mph,
- humidity: 78-82%, 5-7% higher than February-May,
- activity tip: plan outdoor events before 10 AM (85°F) or after 4 PM (87°F).
September Weather and the Island Takeover
September is the warmest month at 84°F (29°C) average due to weakest trade winds (10-14 mph). This creates 95% calm-water probability, ideal for swimming but increases “feels-like” temperature to 96°F (36°C) during midday. The Island Takeover festival capitalizes on 80°F (27°C) evening temperatures and glass-like ocean conditions for beach parties.
October Weather During Brief Rainy Spells
October marks the rainy season start with 3.2 inches across 15 days—showers last 15-20 minutes and occur 65% at night or early morning (5-8 AM). Rain rarely disrupts full-day activities; 85% of showers end by 9 AM. The island greens up within 2 weeks, providing enhanced photography backdrops.
November Weather and International Beach Tennis
November receives 3.9 inches of rainfall across 16 days, the wettest month, but showers are intense 10-15 minute bursts. The Aruba International Beach Tennis Tournament benefits from sandy courts that dry within 30 minutes post-rain. Cloud cover reduces UV index to 9-10, lowering heat stress for athletes competing on 95°F (35°C) sand surfaces.
December Weather for the Holidays
December cools to 86°F (30°C) with 3.5 inches of rainfall across 14 days. The island remains lush from autumn rains while dry-day probability increases to 75%. Holiday festivals and New Year’s Eve fireworks benefit from 77°F (25°C) evening temperatures and 16-18 mph trade winds, creating comfortable conditions for outdoor celebrations.
Navigating the Rainy and Hurricane Seasons
Aruba receives zero direct hurricane hits in recorded history due to its 12.5°N latitude position below the 13°N formation zone. The “rainy season” (October-January) delivers 3.2-3.9 inches monthly—70% falls at night in 10-20 minute bursts, resulting in less than 5% of daytime festival cancellations. This contrasts sharply with northern Caribbean islands where 15-25% of events face weather disruptions during the same period.
Does Aruba Get Affected by Hurricanes?
Aruba sits 500+ miles south of the primary hurricane corridor, resulting in zero direct hits since record-keeping began in 1851. Distant hurricanes (200+ miles away) occasionally reduce wind speeds to 8-10 mph for 2-3 days, increasing “feels-like” temperature by 4-6°F and humidity by 5-8%. These indirect effects occur in less than 3% of years and never produce damaging winds or flooding.
What to Expect During the Rainy Season
The rainy season (October-January) produces 3.2-3.9 inches monthly—equivalent to a single day’s rainfall in tropical rainforest climates. Showers last 10-20 minutes, occur 70% between midnight and 8 AM, and clear within 30 minutes. This pattern results in 75-85% dry-day probability even during peak rainfall months, ensuring minimal festival disruption.
- duration: 10-20 minutes per shower; 95% clear within 30 minutes,
- timing: 70% occur midnight-8 AM; 25% occur 2-5 PM; 5% during evening events,
- impact: less than 5% of festival days experience rain during event hours (10 AM-10 PM).
How Rainfall Patterns Vary by Month
| Month | Average Rainfall (Inches) | Description |
|---|---|---|
| Feb – June | 0.4 – 1.4 | Extremely dry; 90-95% dry-day probability |
| July – Sept | 1.8 – 2.4 | Mostly dry; 80-85% dry-day probability |
| Oct – Jan | 3.2 – 3.9 | Peak rainfall; 75-80% dry-day probability; 70% of rain falls at night |
How Weather Influences Aruba’s Major Festivals
Aruba’s 340+ annual sunshine days and 82°F (28°C) stable temperatures allow 95% of outdoor festivals to proceed as scheduled. The primary weather challenge is UV management: the extreme UV index (11+) causes sunburn in 12 minutes without SPF 50+ protection. Trade winds (10-20 mph) reduce “feels-like” temperature by 5-8°F but can dehydrate participants 40% faster than still-air conditions, requiring 8-10 ounces of water intake per hour during active festival participation.
Weather Considerations for the Grand Carnival Parade
The Grand Carnival Parade (8-hour duration) exposes participants to UV index 11+ for 6+ hours, requiring SPF 50+ reapplication every 90 minutes to prevent burns. Trade winds (18-22 mph in February) cool costume-wearing dancers by 6-8°F but mask dehydration—participants need 64-80 ounces of water during the event. The constant wind also evaporates sweat 40% faster, making sunburn detection difficult until evening.
Managing Heat During Summer Music Festivals
Summer festivals (May-September) face 89-90°F (32°C) daytime temperatures with “feels-like” readings of 95-96°F (35°C) when winds drop below 12 mph. Organizers schedule headline acts after 6 PM when temperatures fall to 85°F (29°C) and winds increase to 15-18 mph. Daytime beach parties rely on ocean proximity and 82°F (28°C) water temperature to manage heat—attendees alternate 20 minutes in sun with 10 minutes in water to maintain comfort.
Evening Weather Conditions for Food and Art Festivals
Evening festivals (6 PM-midnight) benefit from 77-80°F (25-27°C) temperatures and 15-18 mph trade winds. Rain probability drops to 5-8% during February-August evening hours, allowing outdoor dining setups to operate without weather contingencies. The constant wind cools plated food by 8-10°F within 5 minutes, requiring covered serving stations or frequent dish replacement.
Impact of Humidity on Outdoor Festival Activities
Humidity ranges from 75% (February-May) to 82% (September-October), significantly lower than 90%+ levels in northern Caribbean islands. The 7% humidity increase during September-October reduces sweat evaporation efficiency by 15-20%, making the 90°F (32°C) temperature feel like 96°F (36°C). Athletes at the International Beach Tennis Tournament require 25% more hydration (10-12 ounces per hour vs. 8 ounces) during these months to maintain performance.
Planning Your Trip Around the Weather
The optimal weather window is mid-January through May: 85-88°F (29-31°C) temperatures, 0.4-1.2 inches monthly rainfall, and 18-22 mph cooling trade winds. This period aligns with 85% of major festivals including Carnival (February), Soul Beach Music Festival (May), and King’s Day (April 27th). Hotel rates peak 40-60% above low season (September-November) but weather reliability justifies the premium—dry-day probability exceeds 90% vs. 75-80% during rainy months.
When Is the Best Time to Visit for Good Weather?
Mid-January through May delivers optimal conditions: 85-88°F (29-31°C) temperatures, 0.4-1.2 inches monthly rainfall (90-95% dry-day probability), and 18-22 mph trade winds providing 6-8°F cooling effect. This window avoids September’s peak heat (90°F/”feels-like” 96°F) and October-November’s 3.2-3.9 inch rainfall months. The period captures 85% of major festivals while maintaining 340+ sunshine days annually.
How Seasonal Tourist Preferences Affect Crowds
Tourist seasons create 60-80% occupancy variation and 40-60% price swings between peak and low periods. High season (mid-December to mid-April) delivers best weather but increases hotel rates by 40-60% and beach crowding by 70-80%. Shoulder season (May-August) offers 20-30% lower rates with only 5-8°F temperature increase, while low season (September-mid-December) provides 40-60% discounts but faces warmest temperatures (90°F) and highest rainfall (3.2-3.9 inches monthly).
- high season (mid-Dec to mid-April): 85-88°F, 0.4-1.8 inches rain, 80-90% occupancy, rates 40-60% above baseline,
- shoulder season (May to August): 89-90°F, 1.2-2.4 inches rain, 60-70% occupancy, rates 10-20% above baseline,
- low season (Sept to mid-Dec): 87-90°F, 2.4-3.9 inches rain, 40-50% occupancy, rates 40-60% below peak.
What Are the Weather Risks for Travel Safety?
The primary weather risks are UV exposure (index 11+, sunburn in 12 minutes) and wind-accelerated dehydration (40% faster than still air). The extreme UV index requires SPF 50+ reapplication every 90 minutes—failure results in second-degree burns within 3-4 hours of midday exposure. Trade winds (10-20 mph) evaporate sweat rapidly, masking dehydration symptoms until severe; adults need 64-80 ounces of water daily vs. 48-64 ounces in temperate climates. Northern coast (windward side) produces 6-10 foot waves and dangerous rip currents year-round, accounting for 90% of ocean rescue incidents.
- UV exposure: index 11+ year-round; sunburn in 12 minutes; second-degree burns possible in 3-4 hours without SPF 50+,
- dehydration: trade winds increase water needs by 25-30% (64-80 oz daily); symptoms masked by constant evaporation,
- rough seas: northern coast: 6-10 foot waves, rip currents 3-5 mph; swimming prohibited; 90% of rescue incidents occur here.
Packing Essentials for Aruba’s Climate
Aruba’s climate demands UV protection (SPF 50+ reef-safe sunscreen), wind-resistant accessories (hat clips, polarized sunglasses), and breathable fabrics (cotton, linen) that dry quickly in 10-20 mph trade winds. The extreme UV index (11+) requires sunscreen reapplication every 90 minutes—a 7-day trip needs 12-16 ounces of product for adequate protection. Trade winds blow unsecured items away (hats, beach towels) and cool evening temperatures to 76-80°F (24-27°C), necessitating light layers despite tropical location.
What Should You Pack for Festival Days?
Festival days require breathable cotton or linen fabrics that dry within 20-30 minutes in 15-20 mph trade winds. Carnival participants need comfortable sneakers with arch support for 6-8 hours of standing/dancing on hot asphalt (surface temperatures reach 130-140°F/54-60°C at midday). Avoid synthetic fabrics that trap heat and increase core temperature by 2-3°F—this raises dehydration risk by 30-40% during all-day outdoor events.
Protection Against Sun and Wind
UV index 11+ requires SPF 50+ reef-safe sunscreen (12-16 ounces per week-long trip) reapplied every 90 minutes. Trade winds (10-20 mph) blow unsecured hats away—use hat clips or chin straps. Polarized sunglasses reduce glare from white sand (reflects 80% of UV) and water (reflects 10-20% of UV), preventing eye strain and long-term damage during 8+ hour beach days.
- reef-safe sunscreen: SPF 50+; 12-16 oz for 7-day trip; reapply every 90 minutes (6-8 applications daily),
- hat clips: essential for 15-20 mph winds; unsecured hats blow away within 30 seconds,
- sunglasses: polarized lenses block 99% UV; reduce glare from sand (80% reflection) and water (10-20% reflection).
Essentials for Windy Evenings
Evening temperatures drop to 76-80°F (24-27°C) with 15-18 mph trade winds, creating “feels-like” temperatures of 72-76°F (22-24°C)—10-12°F cooler than midday. Pack a light cardigan, denim jacket, or windbreaker for outdoor dining and evening festivals. Long hair requires ties or headbands to prevent constant wind interference during 2-4 hour evening events.